
Latest Tenerife Weather Information
Other weather information at the observatory site.
Weather information as of: 24/07/26 15:14:27
| Sensor | Value |
|---|---|
| Average wind speed | 7.75 km/h |
| Atmospheric pressure | 1011 mbar |
| External temperature | 29.19 °C |
| External humidity | 13 % |
| Cloud temperature | -12 °C |
| Raining | No |
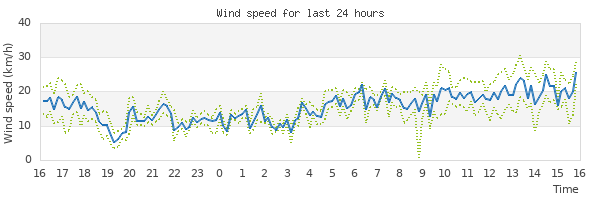
The lines indicate the wind speed values averaged over 10 minutes.
The dotted lines show the minimum and maximum values recorded in the sample intervals.
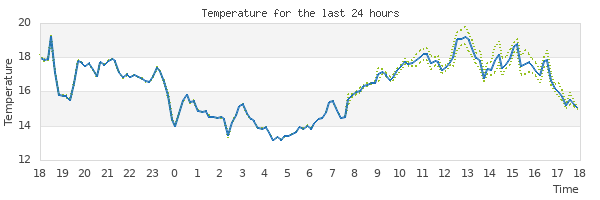
The line indicates the temperature values averaged over 10 minutes.
The dotted lines show the minimum and maximum values recorded in the sample intervals.

The dark blue line indicates the atmospheric pressure averaged over 10 minutes.
The dotted lines show the minimum and maximum values recorded in the sample intervals.
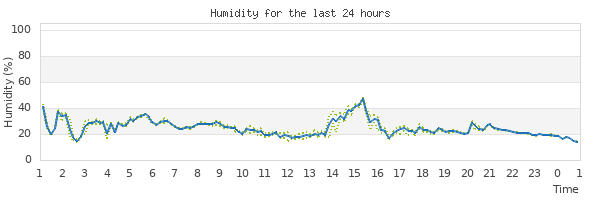
The line indicates the humidity values averaged over 10 minutes.
The dotted lines show the minimum and maximum values recorded in the sample intervals.
The line represents the cloud sensor's detection of cloud temperature.
The dotted lines show the minimum and maximum values recorded in the sample intervals.
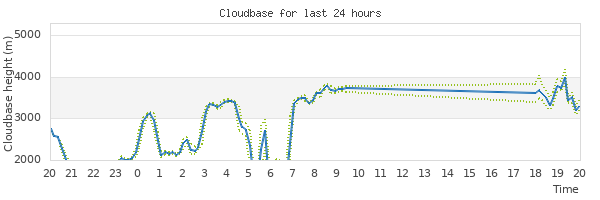
Values below 2800 indicate wetter conditions and below 400 indicate rain.