
Notice
Welcome to Telescope.org from The Open University. An account on this site allows observations to be taken remotely from our robotic telescopes in Tenerife for editing, downloading and sharing.
To use the telescope join the free Open Learn Course 'Astronomy with an online telescope' and follow the instructions to create an account during week four.
You can find more help on the course forum.
The terms and conditions of this website state use is only for personal, non-commercial purposes.
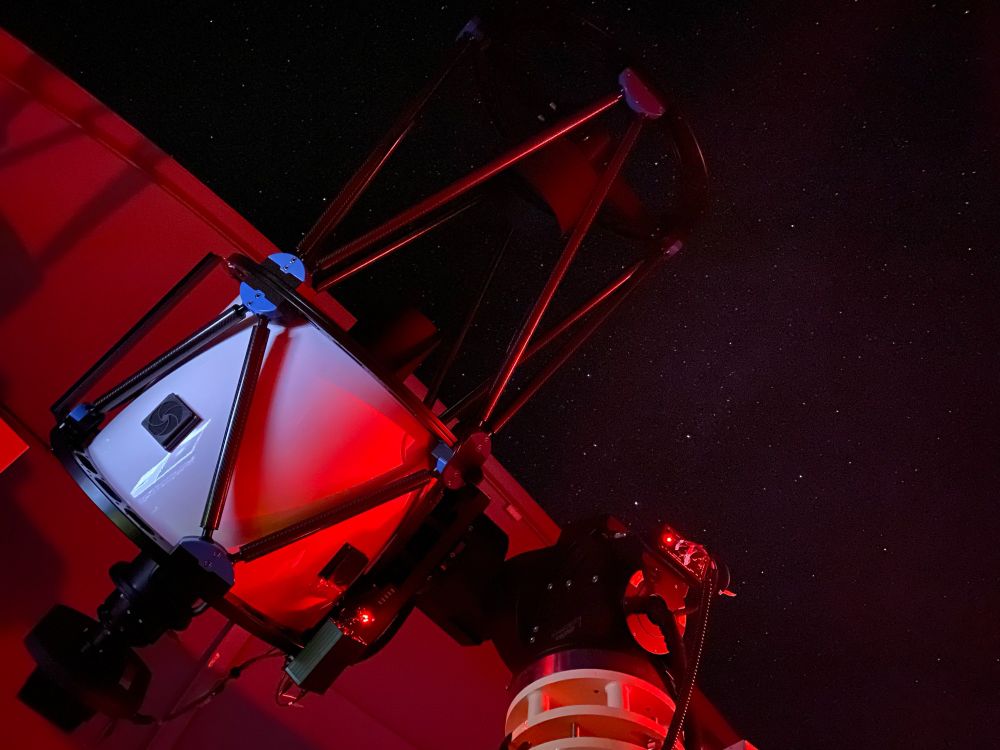
The OpenScience Observatories

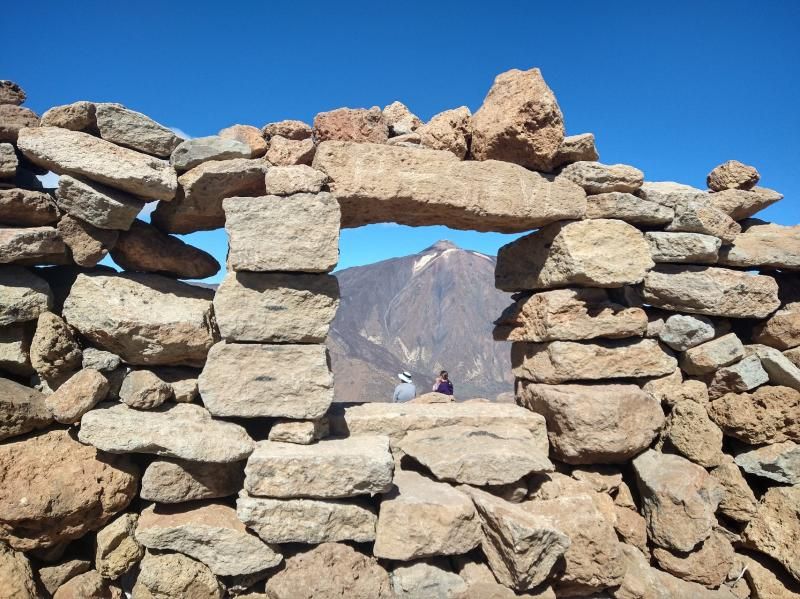
The Open University facilities comprise the COmpletely Autonomous Service Telescope (COAST), The Physics Innovations Robotic Telescope Explorer (PIRATE) and an associated weather station all based on Tenerife.
For more details about Open University courses in Astronomy and Planetary Science see here.
For details about how you can use the COAST telescope as part of a FREE badged course see here.
News
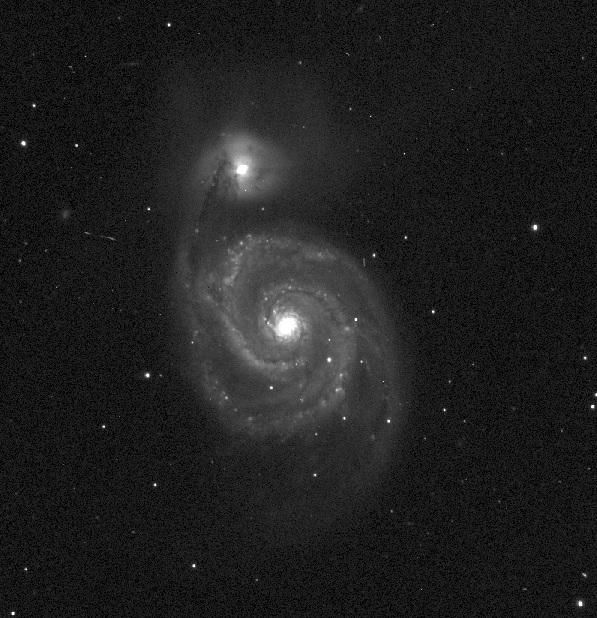
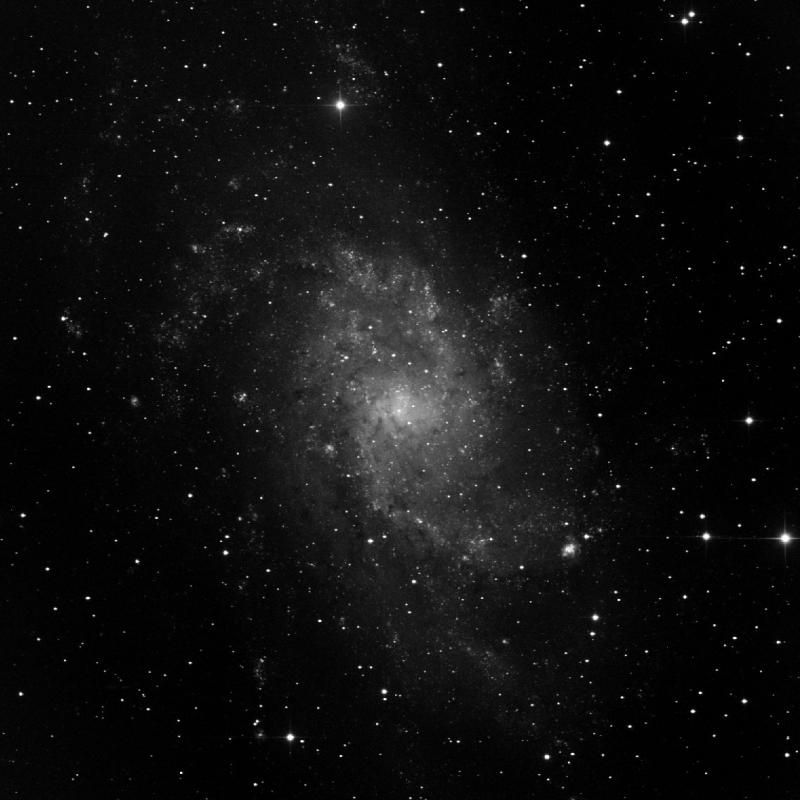

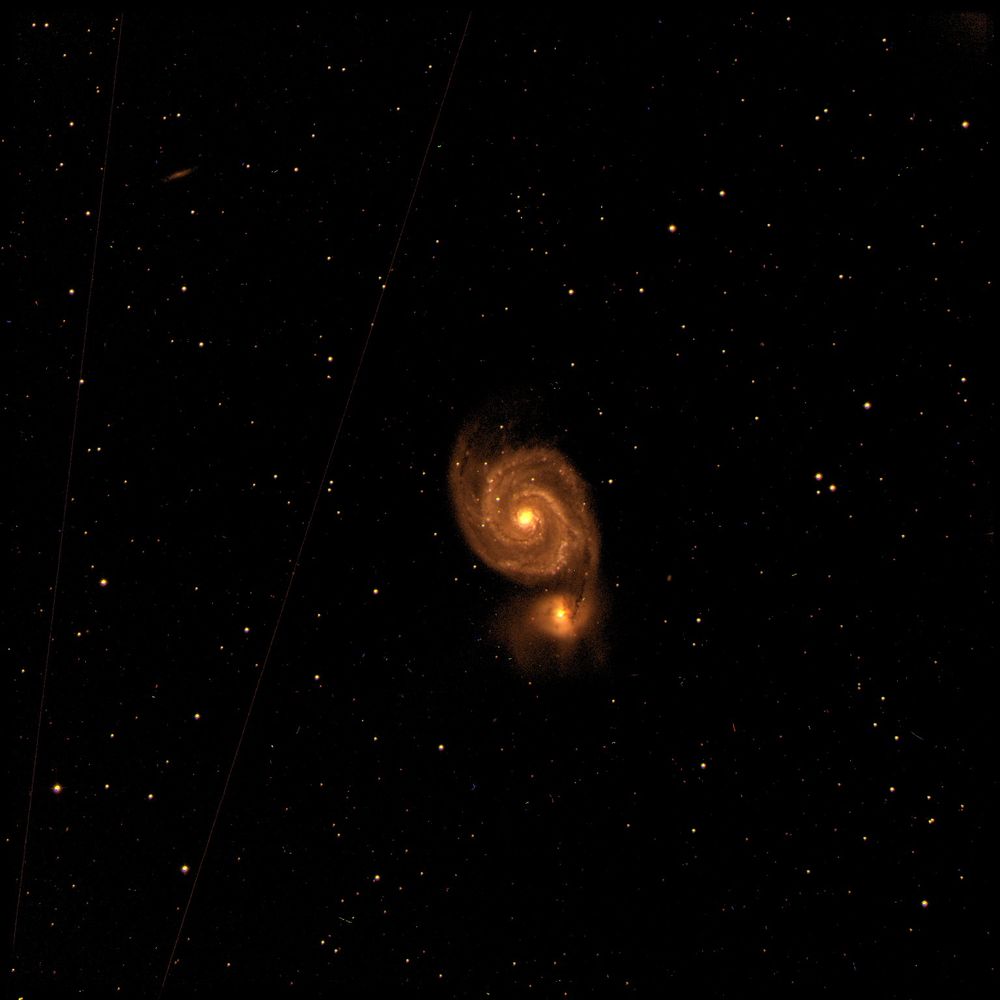

Images
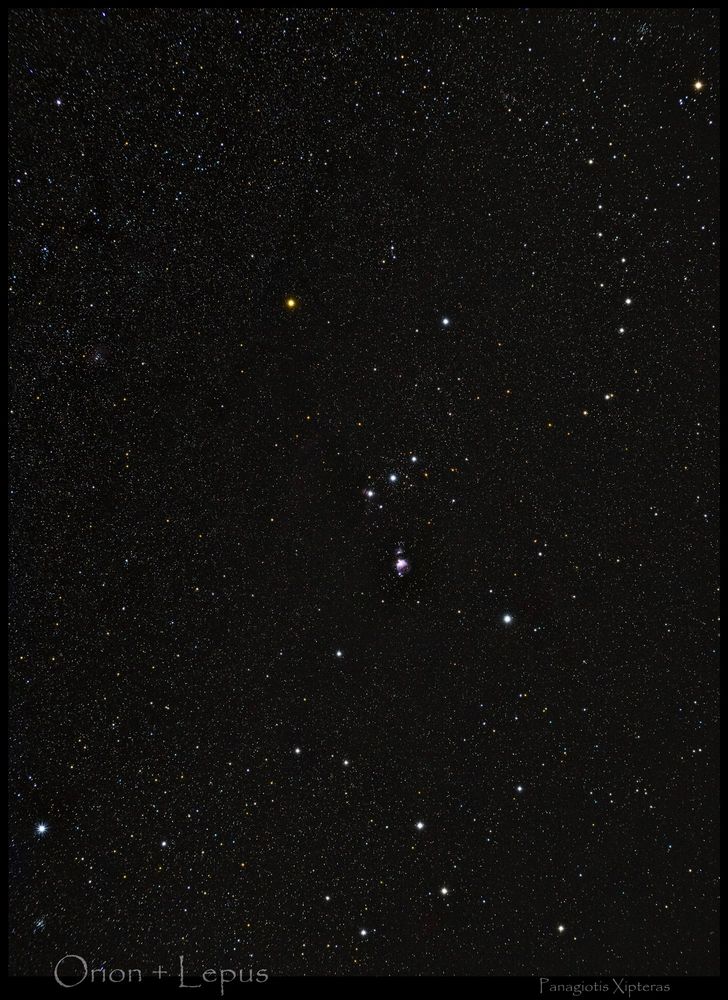
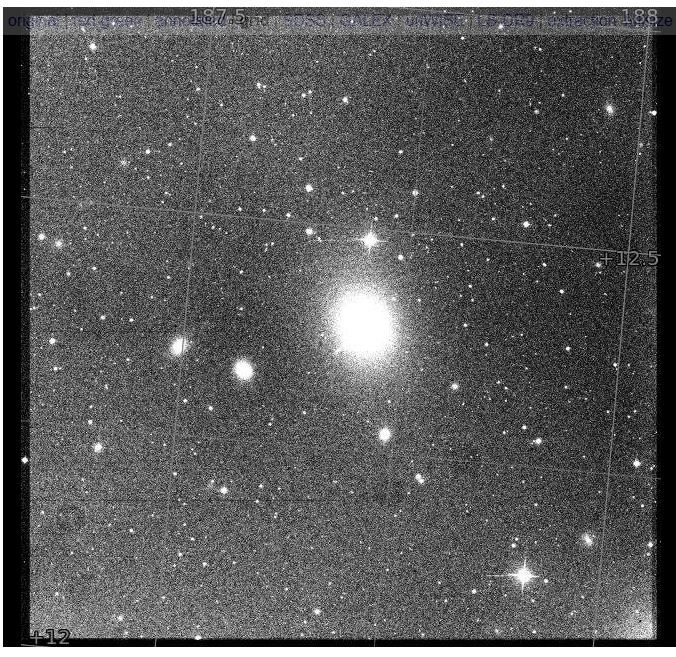
Featured Object:
